chart.js로 차트 만들 때, 반드시 버전 확인하기.
최신버전 : 3.9.1
반틈 도넛 차트를 구현하기위해 구글링하다가 알게된 사실 : ( 버전확인!!!! )
낮은 버전에서 circumference와 rotation의 값을 1 * Math.PI 이런식으로 줬던 모양인데
 options: {
            rotation: 1 * Math.PI,
            circumference: 1 * Math.PI,

}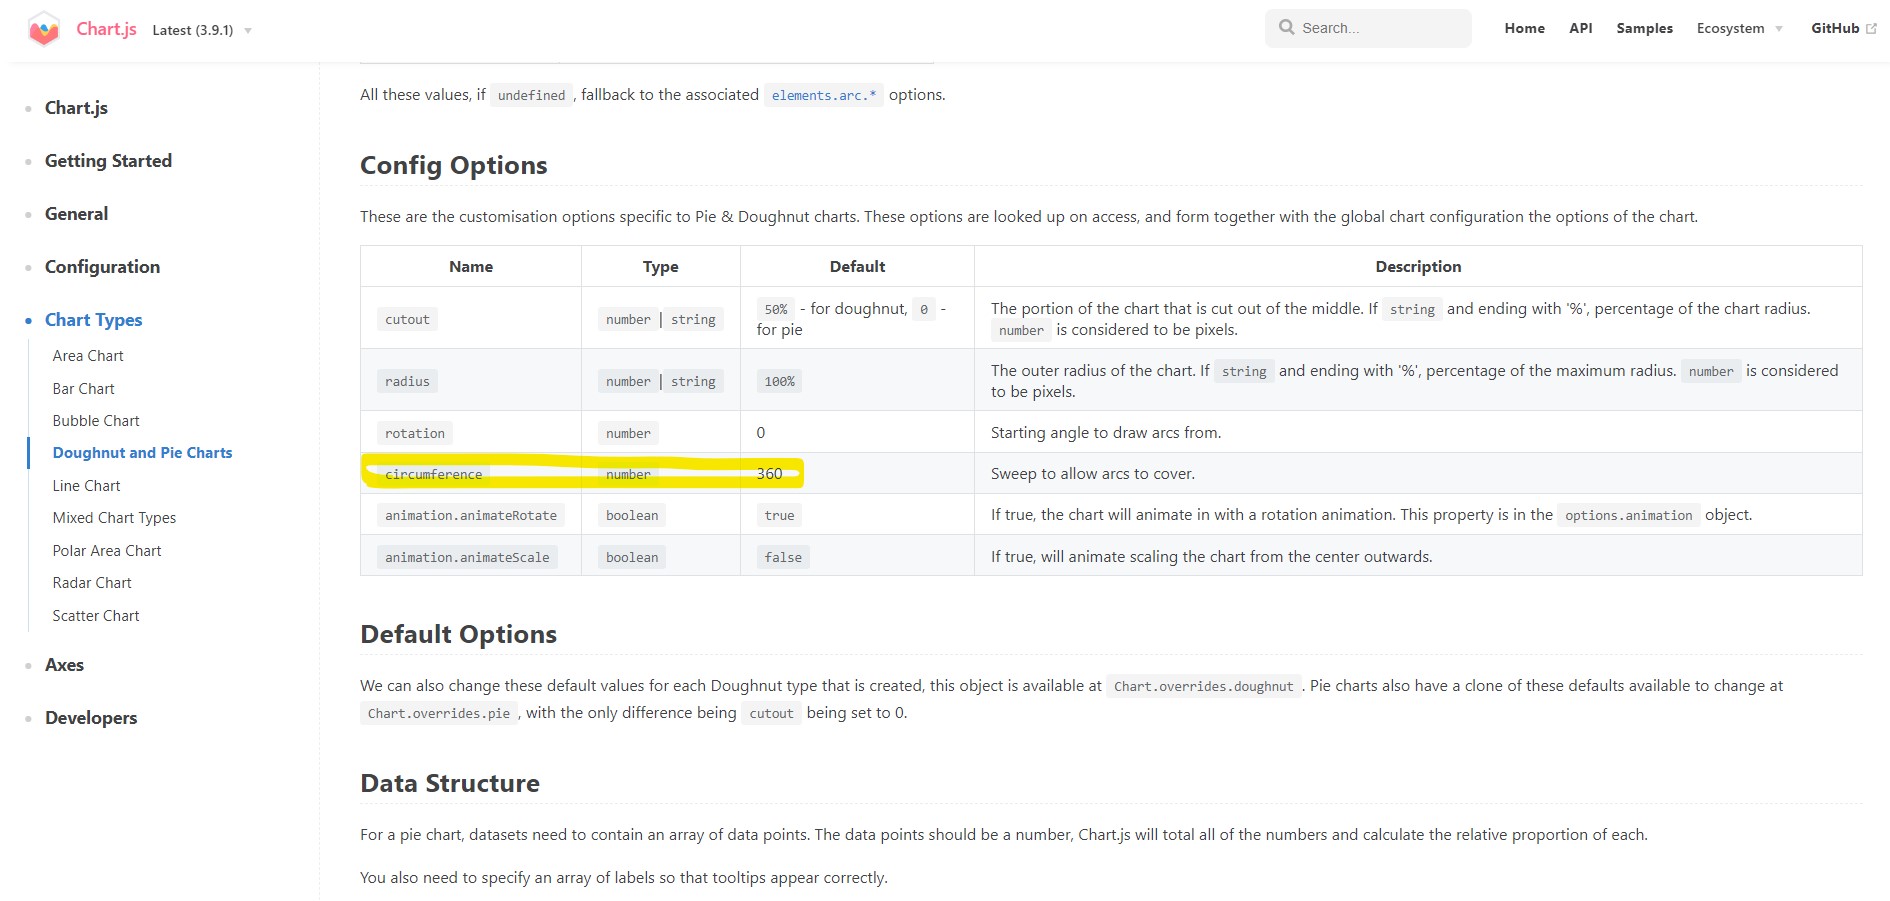
https://www.chartjs.org/docs/3.9.1/charts/doughnut.html#pie
Doughnut and Pie Charts | Chart.js
Doughnut and Pie Charts Pie and doughnut charts are probably the most commonly used charts. They are divided into segments, the arc of each segment shows the proportional value of each piece of data. They are excellent at showing the relational proportions
www.chartjs.org
3.9.1에서는 단순하게 숫자로만 적는다.
  options: {
        rotation: -90,
        circumference: 180,
  }
728x90
300x250
